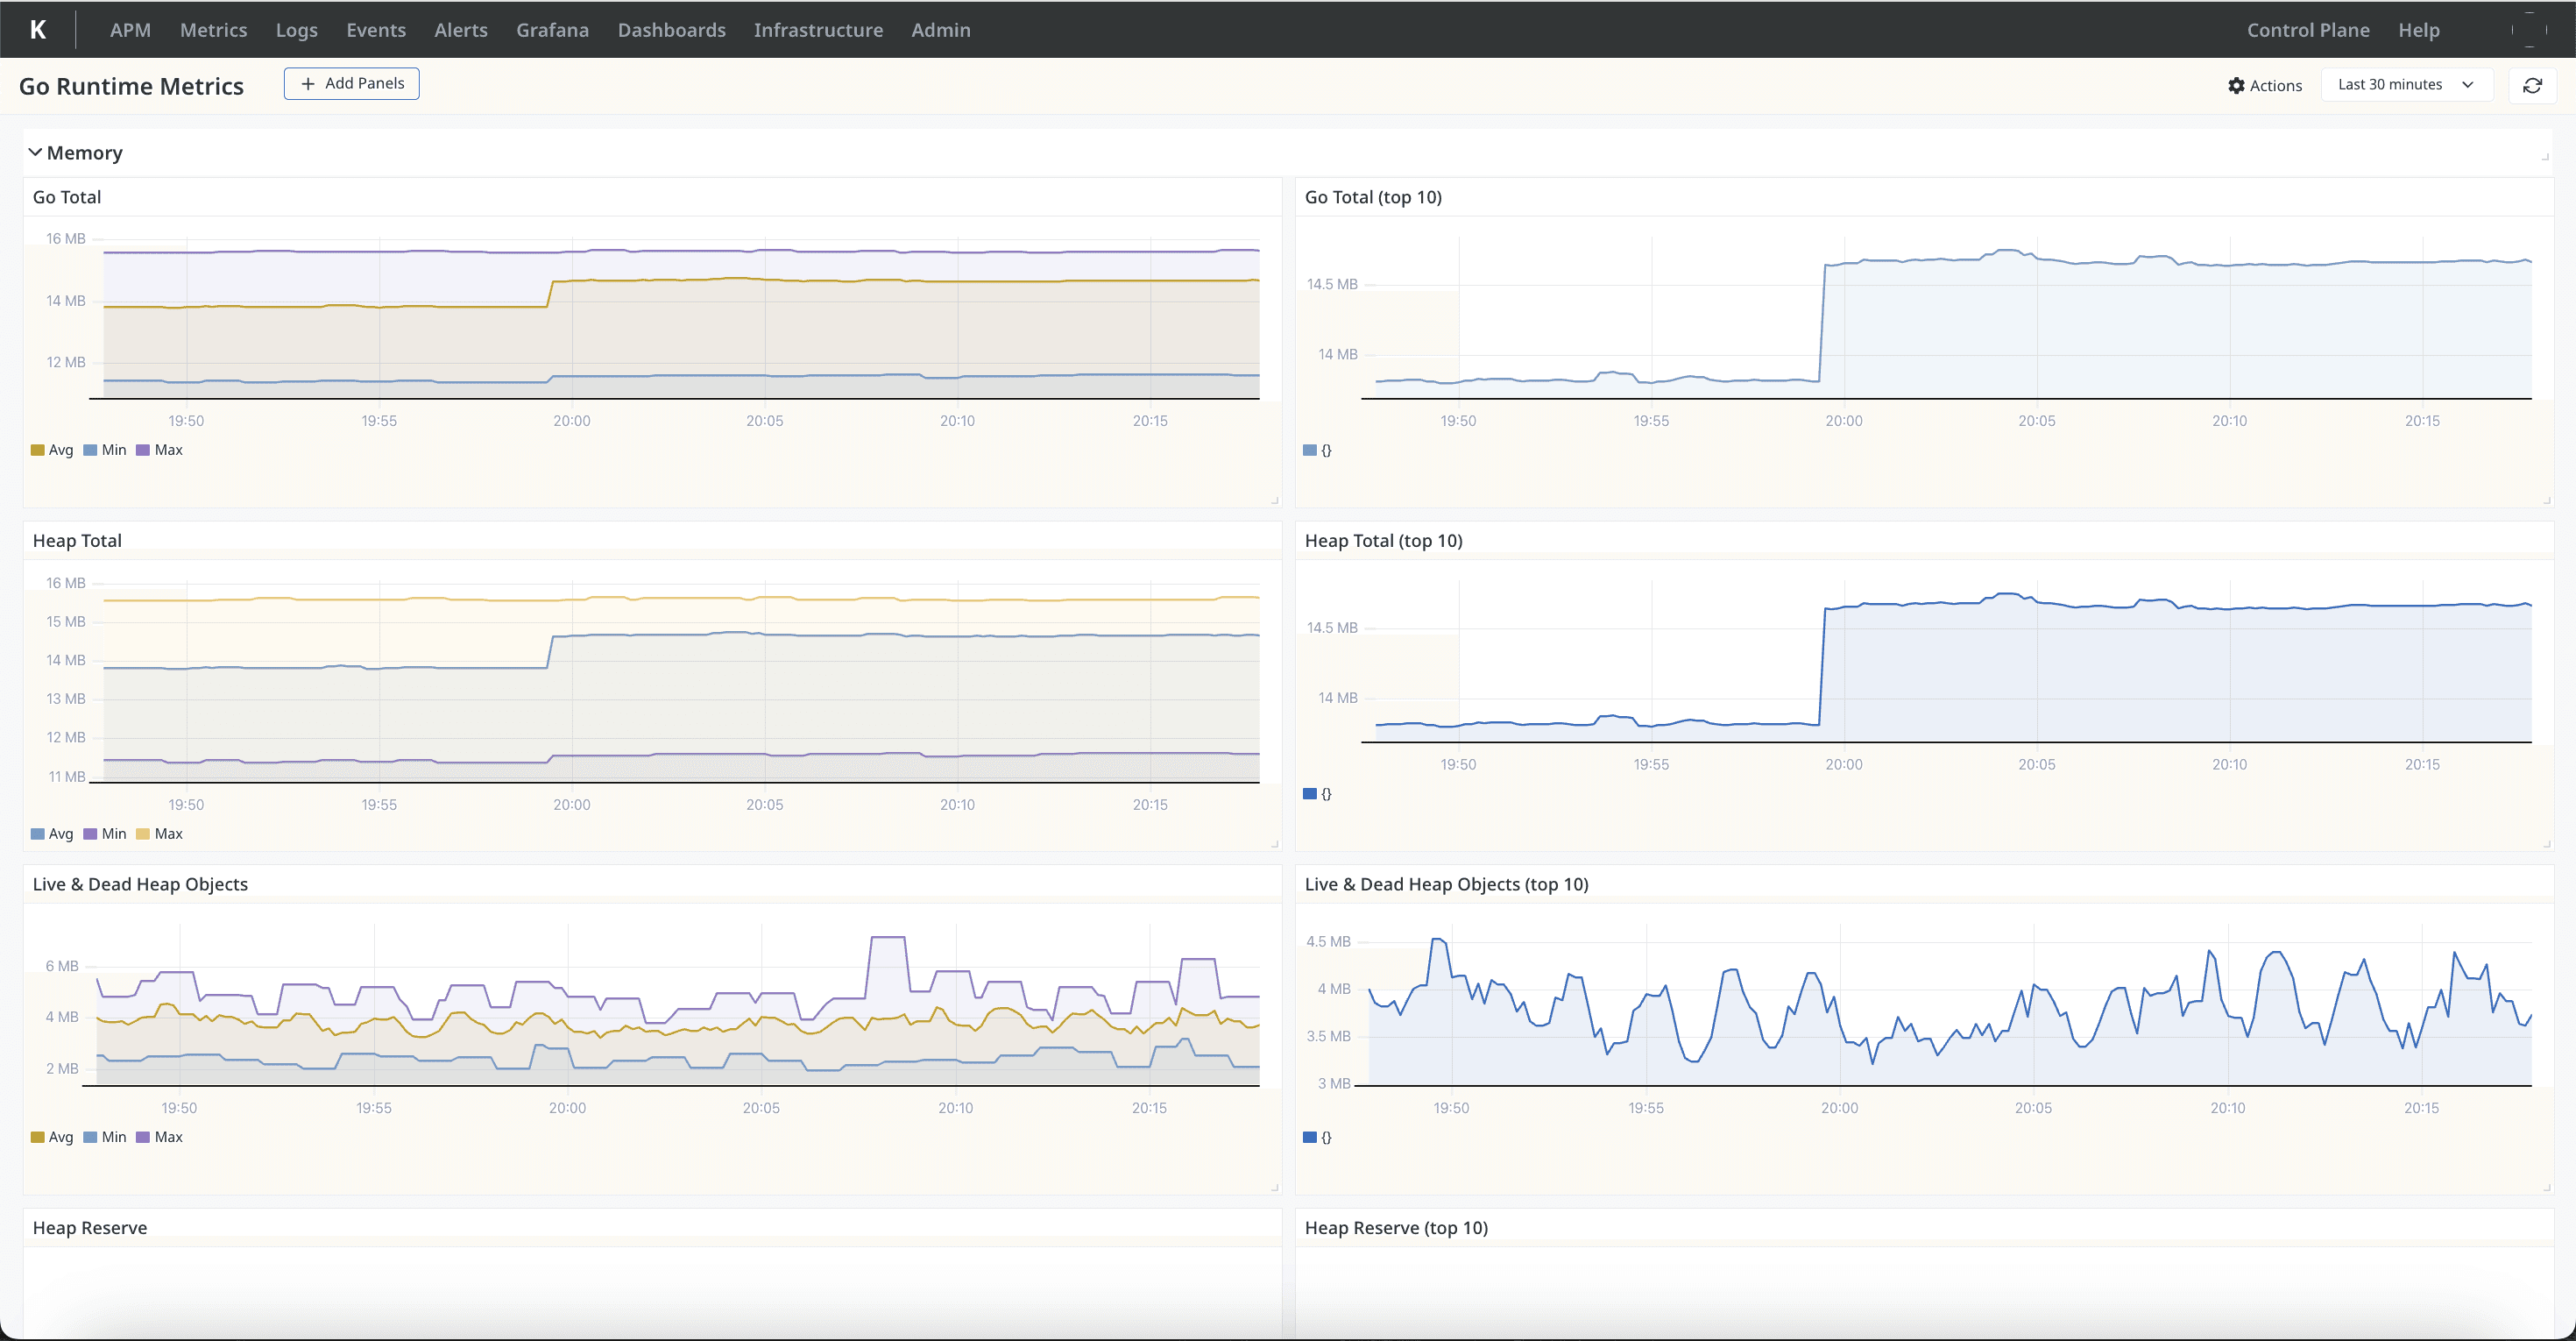
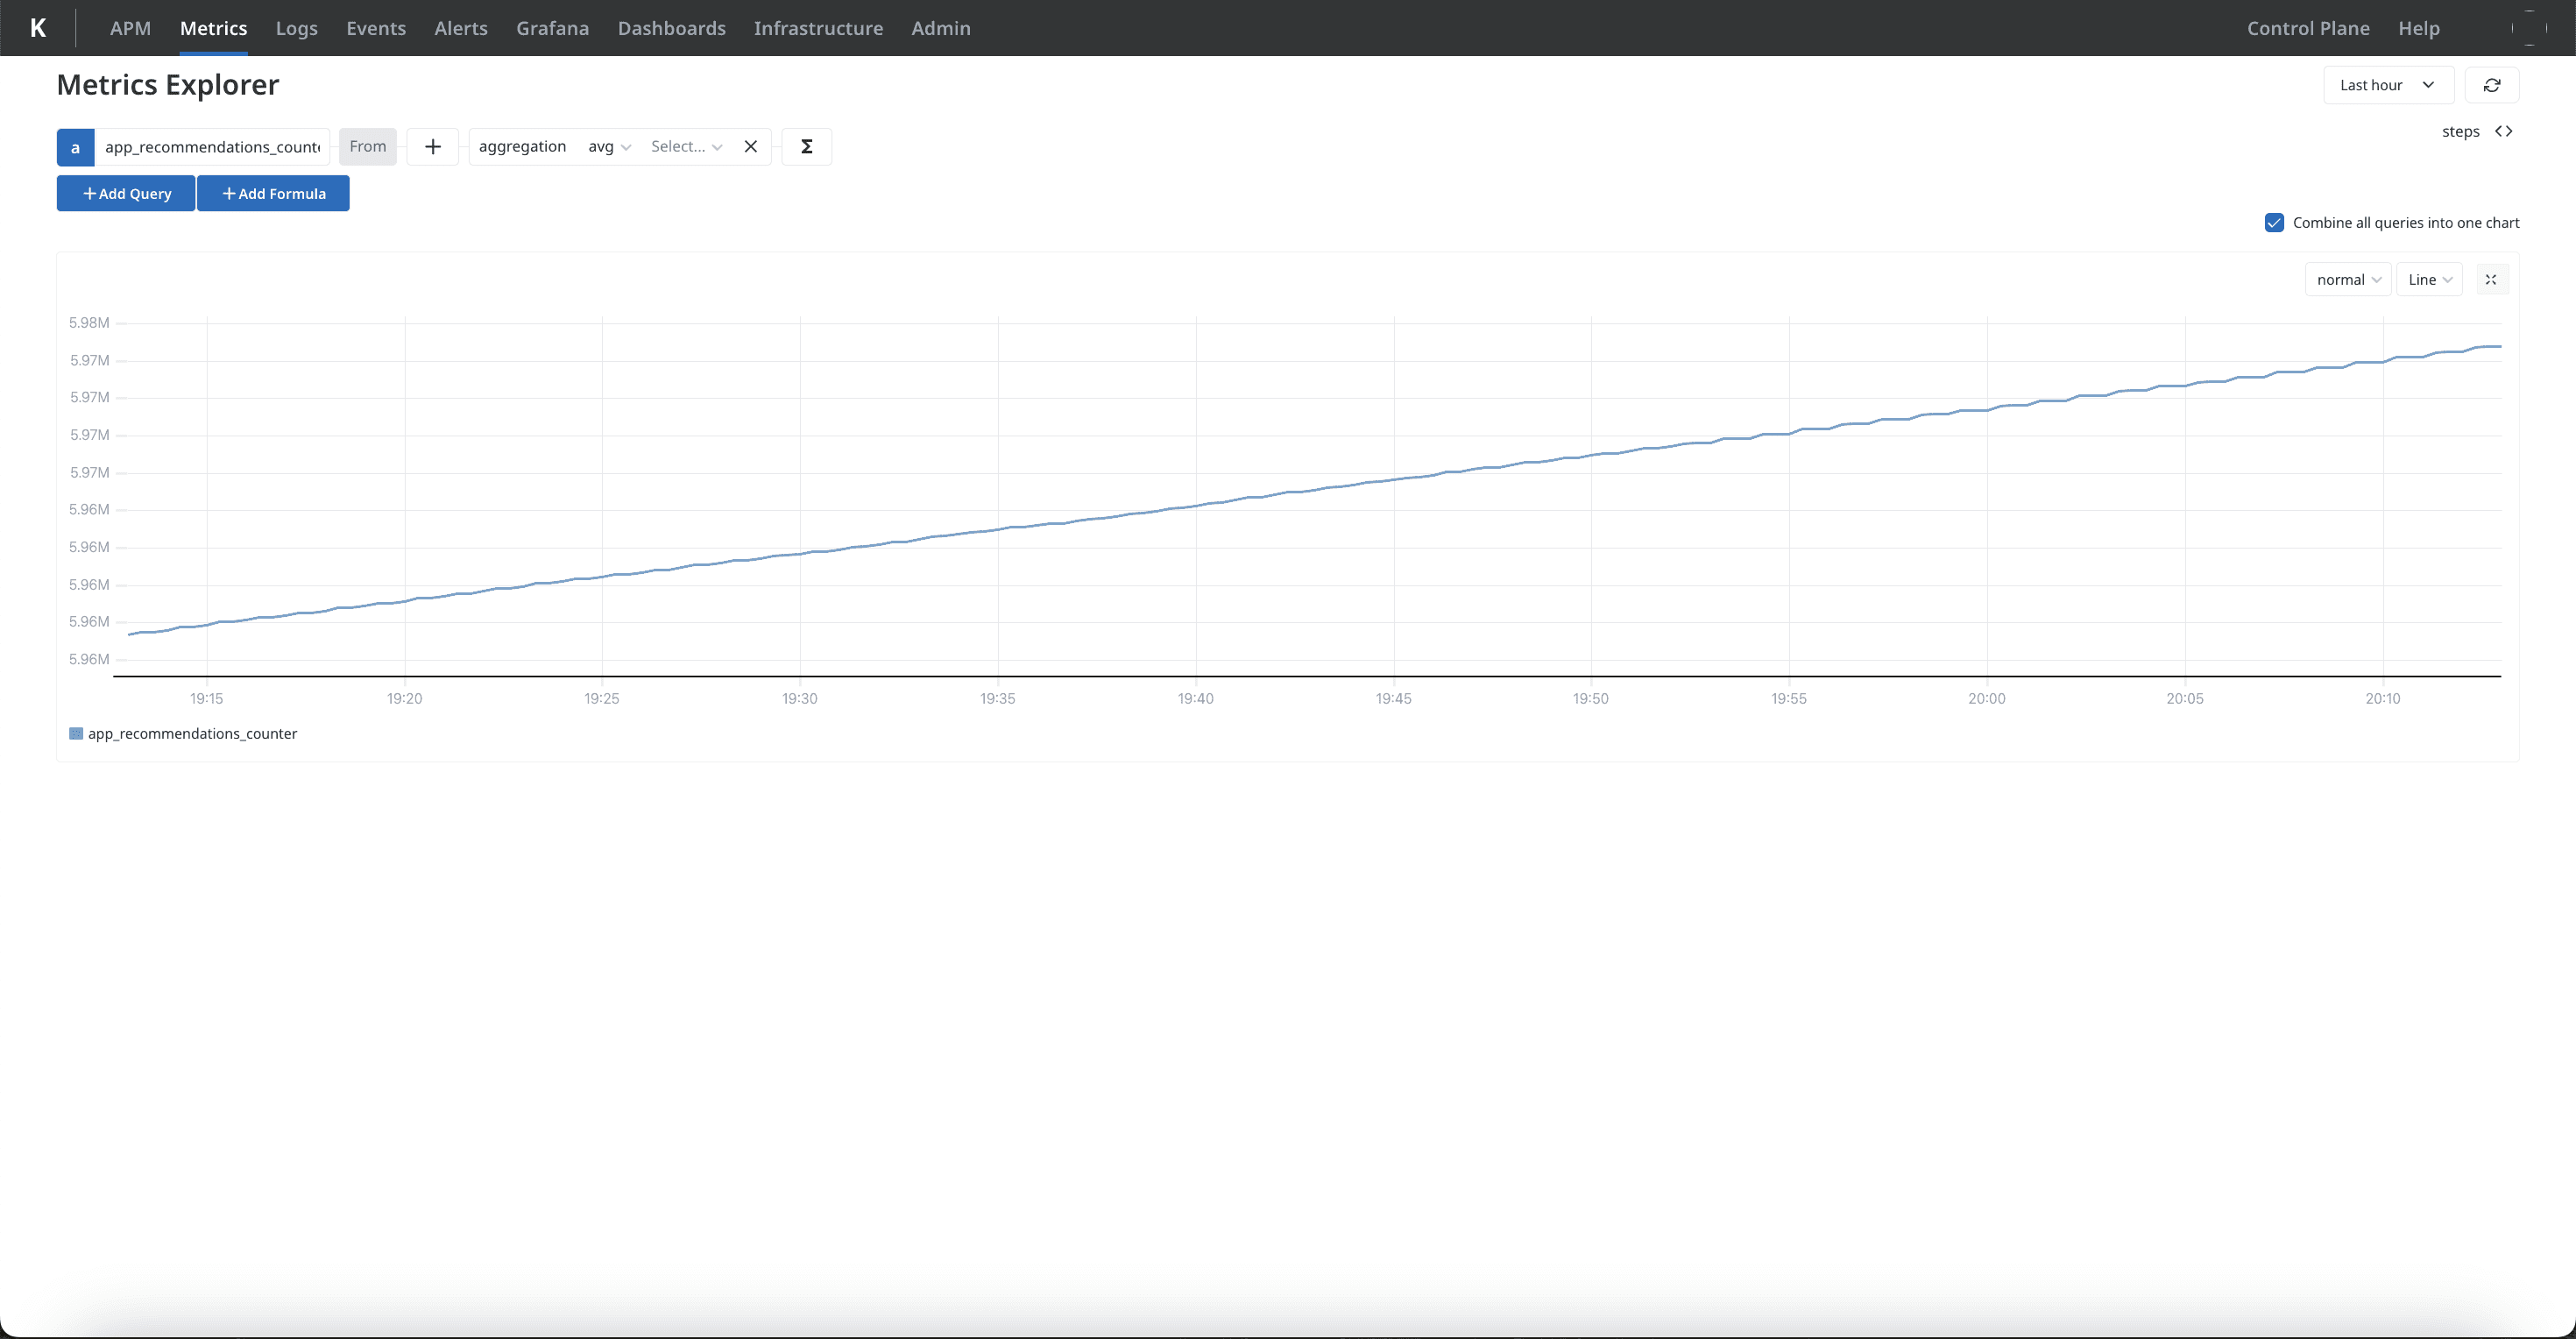
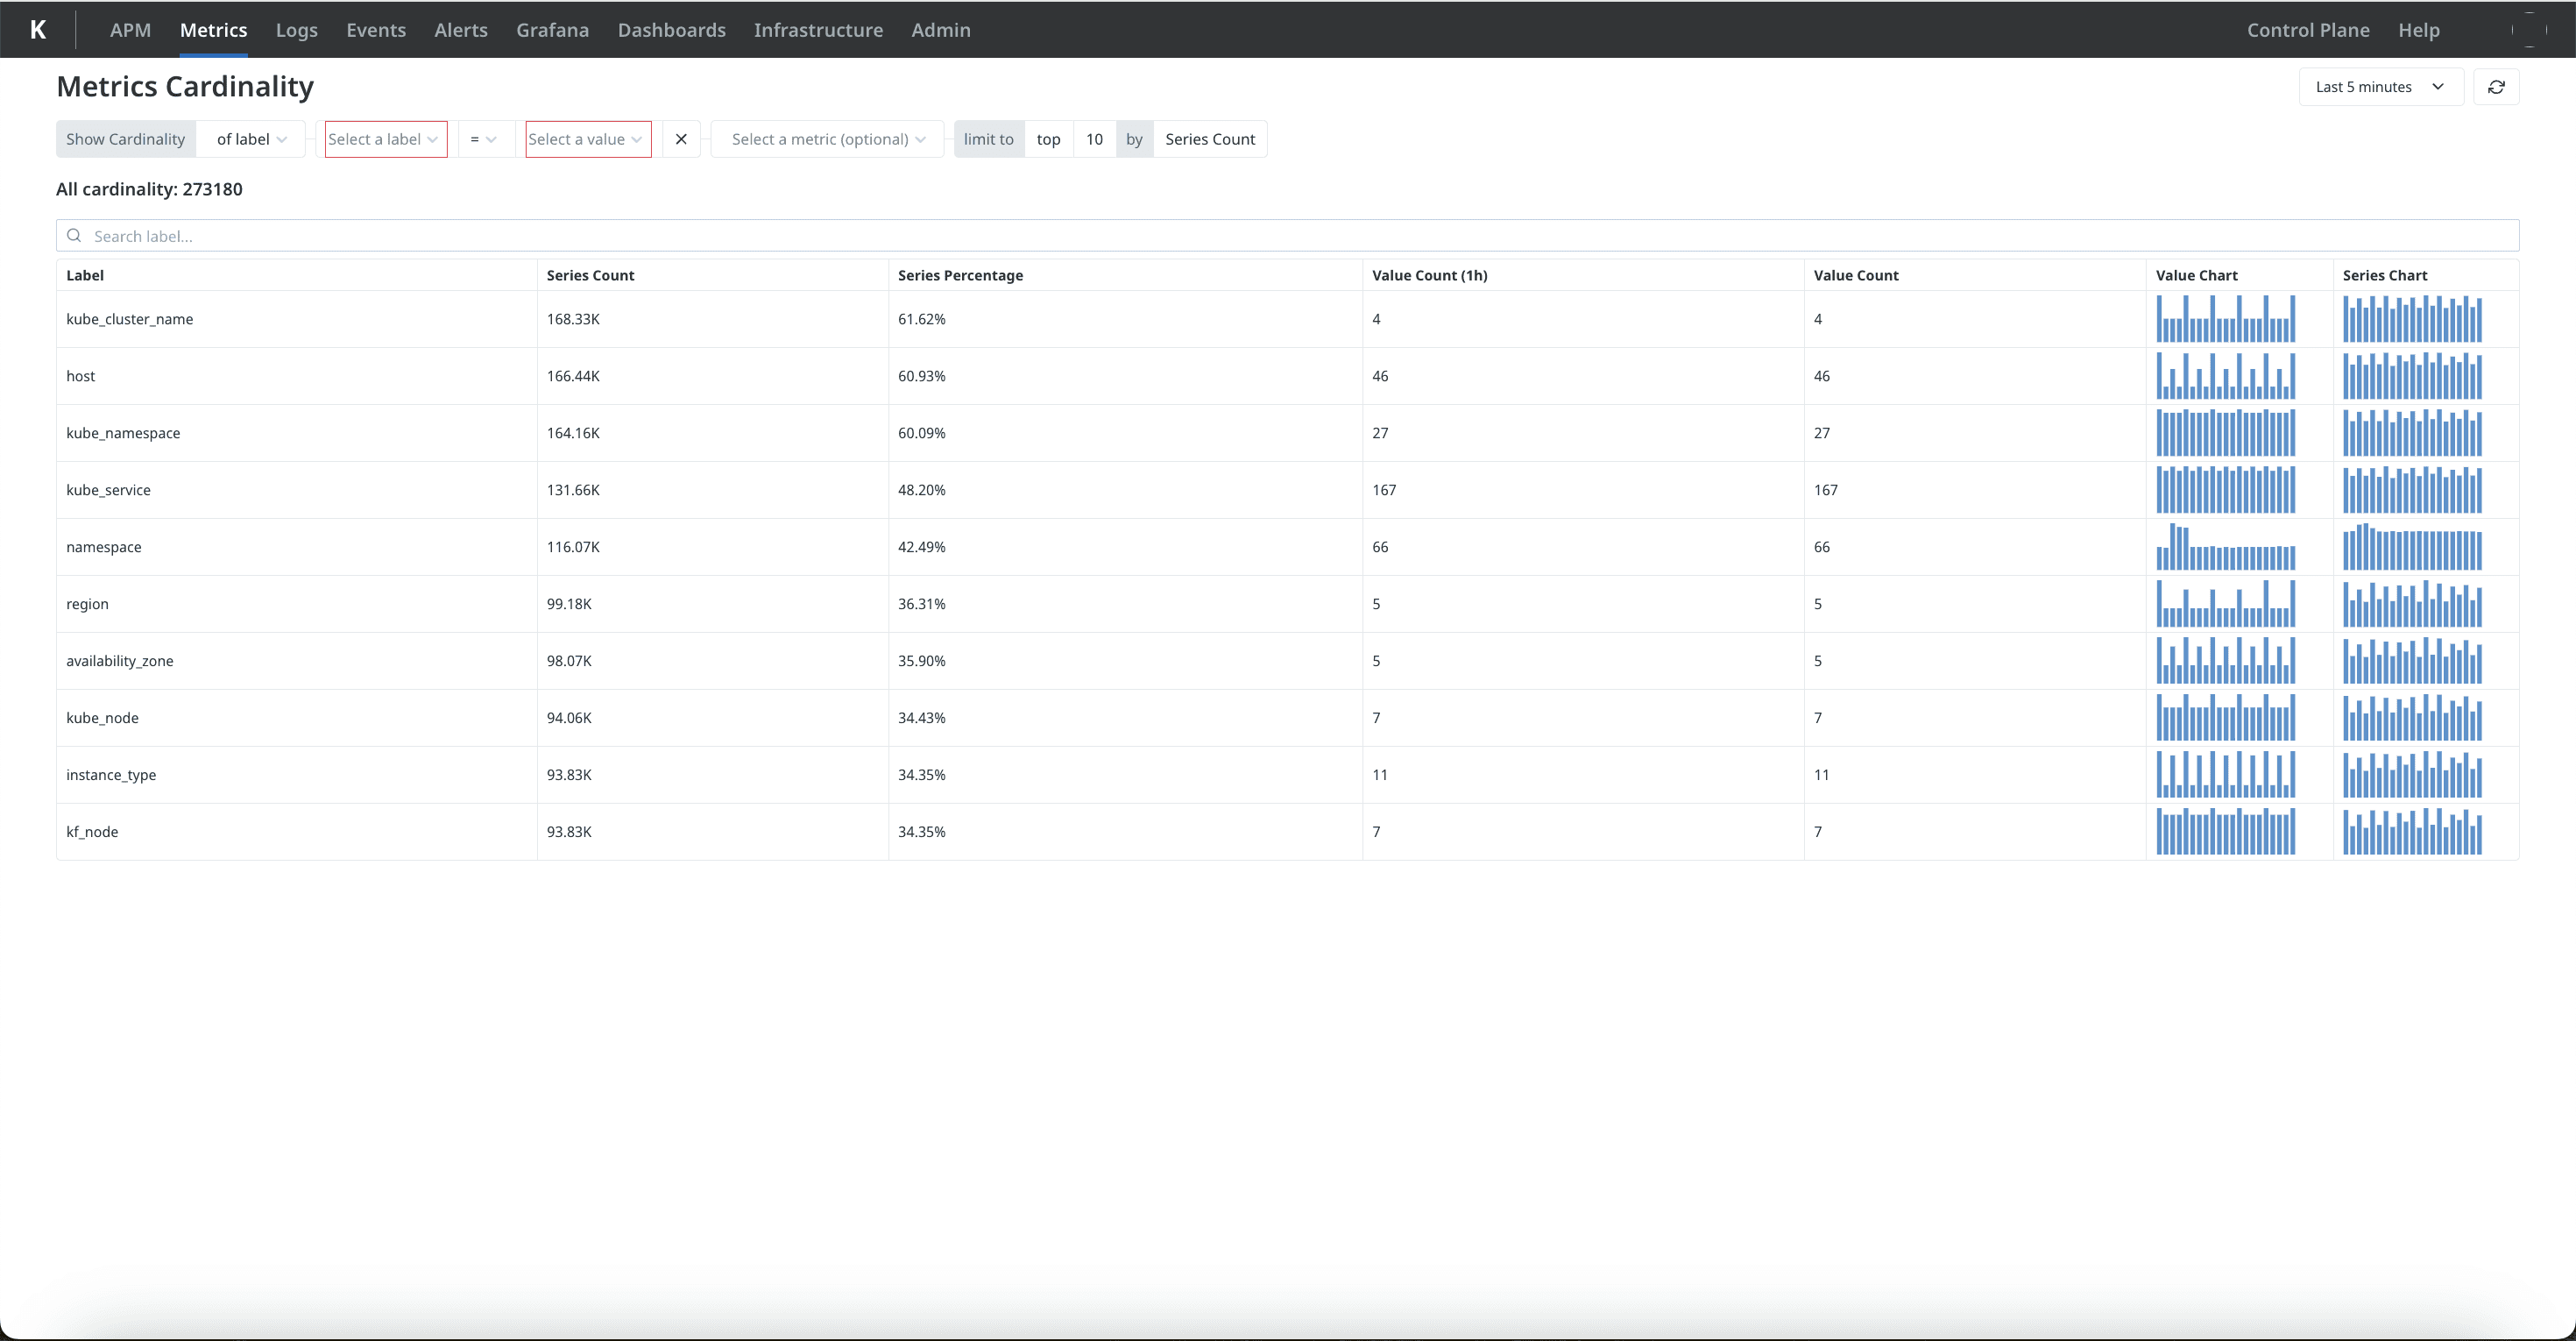
With Kloudfuse, it is easy to store and explore high cardinality metrics across infrastructure, platforms, and applications using any agent or open standard protocols like Prometheus and OTel. Kloudfuse provides high ingestion speed, minimal storage footprint, and access via open query languages, providing you unparalleled visibility and efficiency.
Ingest metrics from any agent (e.g., Prometheus, OTel, DataDog)
Collect natively from all major cloud services (GCP, AWS, Azure)
Query, analyze, and create dashboards using PromQL, Grafana, or Kloudfuse
Automatically convert your existing dashboards and alerts to open standards
Track all infrastructure metrics with built-in dashboards and alerts
Quickly troubleshoot using correlated metrics, traces, and logs
Detect outliers and anomalies using advanced ML and correlation techniques
Ingest, store, and query high cardinality metrics with minimal costs
Analyze high-frequency metrics for accuracy without high computational costs
Host entirely within your VPC and optimize cost-to-value with our control plane


